Incident.io Uses Coding Agents to Debug Its AI SRE

Lawrence Jones, founding engineer at Incident.io, argues that complex AI products now require debugging tools built for agents as well as humans. In a talk on Incident.io’s AI SRE system, which runs hundreds of prompts across telemetry and code during production investigations, Jones describes how the team moved from human trace inspection to agent-addressable evals, downloadable file-system traces, and parallel analysis pipelines to find and fix failures that had become too large to debug manually.
The AI system became too large for humans to debug directly
Lawrence Jones describes Incident.io’s AI SRE work as an attempt to automate production investigations, not merely assist incident response. The company already provides incident response management: paging, incident coordination, and customer communication. The AI target is broader. Whether there is a major incident or a production ticket, Incident.io wants to be the place engineers ask what is happening in production.
That goal has forced the team into systems with enough internal complexity that ordinary human inspection no longer works. Incident.io’s AI SRE has been under development for roughly a year and a half to two years, and Jones says the supporting systems are “on the edge” of what current AI technology can do. The difficulty is not only making the product work. It is understanding when it fails.
A shown example investigation report from the Incident app illustrates the ambition. The report diagnoses users unable to create internal status pages, ties the failure to PostgreSQL query parameter limits, calculates how a catalog-backed field with 57,507 active entries produced 115,017 query parameters, compares that number against PostgreSQL’s hard limit of 65,535, and identifies a pull request that truncates item IDs but may not fully address a systemic batching problem. It also links the failure mode to prior incidents on different code paths.
An investigation like this is produced at the start of an incident after “hundreds of telemetry queries,” according to Jones. The system looks through logs, metrics, traces, historical incident data, and the customer’s codebase, then tries to produce a plausible root cause and recommended fix.
The harder question is how to tell whether that report is good.
A human reviewer can join the incident, read everything that happened, inspect any postmortem, and decide whether the AI’s report was right or useful. But Jones says that can take about an hour for a real understanding of a single incident. Behind the report, meanwhile, are “hundreds if not thousands of prompts.” The challenge is not judging one answer once. It is understanding performance across many customer accounts, each with different systems and failure modes.
You end up with a lot of stuff, a lot of AI, and you've got to use AI to try and actually tractably get a handle on this.


That constraint drives the rest of Jones’s approach: the tooling for production AI has to be inspectable and operable by AI agents, because the systems themselves have outgrown manual debugging.
Evals are unit tests, but production failures make them unwieldy
Jones treats evals as AI unit tests. In Incident.io’s setup, an eval takes a prompt, supplies input data, runs the prompt, captures the output, and applies grading criteria to decide whether the case passes or fails. The eval files live as YAML next to Go prompt code; Jones says Incident.io writes its AI work in Go.
To explain the pattern, he uses a deliberately simple pirate-translation prompt. The prompt accepts a message, asks the model to translate it into pirate speech, and returns the translated message. Its eval checks two things: whether the output resembles pirate speak and whether the original meaning was preserved. Those matchers are implemented as grading prompts with 1–4 scales, passing when the grade is at least 3. The cases are stored in YAML and the eval tool reports pass/fail results by case and matcher.
The toy example works cleanly. The production version does not stay clean.
Realistic eval data is “really, really fiddly,” especially when the only way to reproduce a bad behavior is to include almost an entire incident. Incident.io built a button early on to “steal an eval from production”: when an AI interaction went wrong, an engineer could pull it into the codebase and run it against the eval suite. The interface includes a “Save as Eval” flow and a warning that engineers should anonymize data before committing it, with the UI text noting that Claude is useful for that.
But production-derived evals are poor unit tests if they arrive as enormous blobs. Jones’s preferred unit test is focused and understandable: “I expect it to do this thing.” A production incident captured verbatim can become megabytes of YAML. That is difficult for humans to maintain and, in Incident.io’s experience, difficult for coding agents to use.
As the YAML files grew, agents could no longer perform quick read-and-modify operations on the suite. Loading the whole file into context would hit context limits. The team’s answer was not to ask agents to become better at giant YAML files. It was to build a small CLI around the eval files.
The tool, called evaltool, exposes operations an agent can use: list file metadata and cases, retrieve a case by name or index, replace a case, add a case before or after another, and delete a case. This let agents manipulate eval suites without swallowing the entire file at once.
That enabled a runbook Jones calls red-green prompt development. The rule is close to test-driven development: do not modify prompts blind. First identify the broken behavior. Then write an eval that fails. Then adjust the prompt, tool, or agent configuration until the eval passes. Then run the full suite to make sure other scenarios did not regress. Finally, consolidate the prompt if the repeated fixes have made it large and hard to maintain.
The runbook states the principle bluntly: “If you can’t write an eval that demonstrates the problem, you probably don’t need the change.” The eval documents why the fix exists, verifies the fix, and protects against future regressions. Without this discipline, a prompt accumulates “unspeakable cruft.”
A Claude Code session following the process for a real Incident.io prompt turns human requests into Loki log queries. The agent adds a case, runs the eval with actual outputs printed, updates expected values, repeats the eval three times, observes a semantic-query check issue, updates the expectation, reruns the case, and finally runs the broader suite. The full suite passes 7 out of 8 cases, which the agent reports as an 87% pass rate within the expected range for semantic log queries.
Jones’s point is narrow and useful: if you already know which prompt to change, a small agent-friendly eval interface plus a strict red-green runbook can make prompt changes more reliable. The remaining problem is finding the right prompt in the first place.
Knowing what to change is harder than changing it
The eval workflow solves only the local repair problem. The larger production problem is that modern AI systems are rarely one prompt. They are many prompts, tools, and agents connected in a hierarchy.
To demonstrate this, Lawrence Jones uses Incident.io’s incident chatbot. Its graph includes agent and tool names such as AgentProviders, IncidentResponder, AlertInvestigator, KnowledgeQuery, DataQuery, and ReportGenerator. He says there are around 10 agents and many more prompts and tools; the graph is larger than he could fit on the screen. A bad customer interaction does not immediately reveal which part of that graph caused the problem.
The investigation system is even harder. Its process flow expands into deeply nested traces, with steps such as KnowledgeQuery, RelevantChangesQuery, DataQuery, CodeQuery, ReviewIncidents, and CodeQuerySession. Each green block in the interface can expand into hundreds of prompts and hundreds of tool calls. A subtle error at any point can propagate into a wrong overall picture and a wrong root cause analysis.
Incident.io had already built UI tools for humans to inspect those traces. Those tools were useful, but not enough. Humans did not have time to traverse everything. Agents, meanwhile, could not properly use the UI.
The team’s key move was to stop treating the debugging interface as something only a browser could render. Jones says Claude Code showed that agents are very effective with file systems and standard tools. Incident.io asked whether its debugging UIs could simply be downloaded as a file system.
That became what Jones calls the biggest unlock.
For each AI system, Incident.io can now export the full interaction into a directory structure. A chatbot thread, for example, is represented with visible files and folders such as actions.yaml, message.md, metadata.json, response.md, and subdirectories for tool inputs and results. Jones says the exported package includes self-documenting structure, so an agent can inspect what went into prompts, tools, and traces using normal file operations. The team drops this into a sandboxed Claude Code session, describes the bad behavior, and asks the agent to interpret what happened.
| Visible artifact | How Jones says the package is used |
|---|---|
| `actions.yaml` | Part of the downloaded interaction file system |
| `message.md` | Part of the downloaded interaction file system |
| `metadata.json` | Part of the downloaded interaction file system |
| `response.md` | Part of the downloaded interaction file system |
| `tools/inputs` | A visible directory in the downloaded package |
| `tools/results` | A visible directory in the downloaded package |
| `trace.md` | A text representation of the activity hierarchy that an LLM can consume |
Because the same session can also access the codebase, the agent can move from trace analysis to a proposed code or prompt location. Jones describes the workflow as: a score or customer report flags a bad experience; the team downloads the interaction to Claude Code; the engineer asks the agent to read the trace and explain what went wrong; the engineer describes the desired behavior; the agent works through the hierarchy of tools and prompts to identify the likely change; then the team either fixes a bug or applies the red-green eval process to adjust a prompt.
The export does not need to be visually elegant to be useful. “There is really not much of a limit as to what you can put into ASCII,” Jones says. A trace that appears in the UI can be represented as a text file with hierarchy, timing, costs, spans, and names. The point is not to mimic the UI. It is to place the same information where coding agents are already strong: files, folders, markdown, YAML, JSON, grep, and code search.
Jones explicitly contrasts this with more elaborate integration approaches. At the end of the talk, he says Incident.io could have put an MCP layer over the debugging data or used more human-like agents, but that it “wouldn’t have been half as effective” as downloading all the needed information in bulk so a coding agent can search through it.
Backtests give a score; analysis pipelines explain the score
The file-system export works for one bad interaction. Incident.io’s next problem was scale.
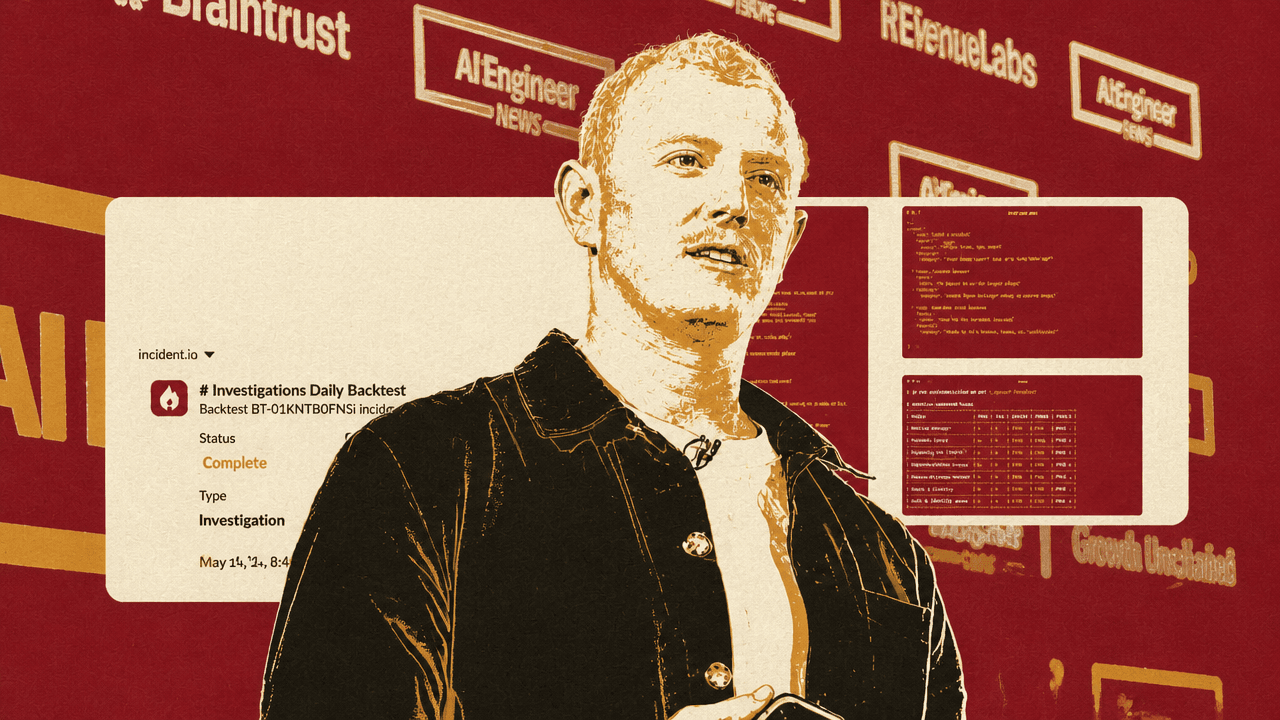
Jones says the company runs thousands of investigations across hundreds of customer accounts, and that it runs daily backtests against Incident.io’s own account and many customer accounts because it needs to know whether the system is improving or deteriorating. A completed daily investigation backtest in the Incident app records 21 out of 21 investigations scored and 86.2% accuracy, up 1.3%.
A rolled-up accuracy number is useful but insufficient. It does not explain why the number rose or fell, and it does not tell the team how to improve the system for a specific customer account.
Incident.io’s answer is to download the full batch of investigations into a file system and feed that into an analysis pipeline run with Claude Code. The pipeline is structured by markdown playbooks so it can be repeated reliably. Lawrence Jones says the team created a repository called Scrapbook to collect and analyze daily backtest results. Its directory structure includes playbooks for setup, per-investigation analysis, cohort clustering, and synthesis.
The pipeline starts by parallelizing the work. Jones says they may launch 25 agents in parallel, each building an analysis of one investigation. The next stage clusters the resulting analyses into cohorts: the same types of failure, recurring wrong turns, or common reasons the system performed well or badly. The final report is meant to explain not just that investigations failed, but why the AI system performed the way it did on an account and what changes might improve it.
Jones identifies several design requirements for these pipelines.
First, use sub-agents for per-entity analysis. Each investigation can be reviewed independently before results are merged.
Second, store all agent output in files inside the downloaded package. That creates incremental analysis artifacts, so the run can be paused, resumed, or inspected rather than existing only as a transient chat session.
Third, structure the work in stages. The Scrapbook layout makes setup, per-investigation review, clustering, and synthesis explicit.
Fourth, combine the downloaded traces and results with the codebase. If the analysis identifies a problem, the agent can inspect the implementation and suggest where to change it.
Fifth, make code changes from the same loaded session when appropriate. Once the analysis, code, and runbook are all available, the agent can be asked to implement the change and then validate it through the eval workflow.
The pull request Jones uses as an example is titled “Feed previous hypothesis review into the next hypothesis build.” In the visible comment, Jones writes that backtest regressions in two incidents showed the hypothesis review correctly identified weaknesses and better alternatives, but the next hypothesis build never saw that critique. The system would re-derive the hypothesis from raw findings and anchor on the same wrong framing. The change sends the previous review’s assessment, alternative hypotheses, conviction grade, and reasoning into the next hypothesis build when a tunable is enabled.
In that example, a backtest regression becomes a clustered failure pattern, the failure pattern becomes a precise system diagnosis, and the diagnosis becomes a targeted change.
The internal tools have to be built for agents, not only for engineers
Jones’s general claim is that these patterns are not specific to Incident.io’s AI SRE product. They apply to teams building complicated AI systems that are hard to understand, debug, or evolve.
The first pattern is to make eval systems agent-addressable. The obstacle was not the concept of evals. Incident.io already had prompt tests, matchers, YAML cases, and production-derived examples. The obstacle was that large eval files were unusable as agent context. A small CLI changed the interface so agents could add, fetch, replace, and run cases without loading everything.
The second pattern is to convert debugging views into file-system artifacts. Incident.io had useful UIs for traces and interactions, but agents could not use them well. Exporting the same information as self-documenting folders and text files let coding agents search, inspect, and connect trace behavior back to the code.
The third pattern is to turn repeated expert analysis into AI runbooks. When a team repeatedly performs a complex investigation—reviewing many backtest results, comparing failures, clustering patterns, and proposing changes—Jones argues that the process should be written down as a playbook for agents. In his words, this can save “literally days or maybe weeks” of work.
Jones’s strongest practical recommendation is to prioritize internal debugging tools with the same seriousness as product-facing AI. If teams use coding agents daily, the tools for understanding AI systems should be designed for those agents from the start. The unit of usability is no longer only a human-friendly dashboard. It is also a structured directory, stable files, repeatable commands, and playbooks an agent can execute.