Production Inference Turns Transformer Models Into a Full-Stack Systems Problem
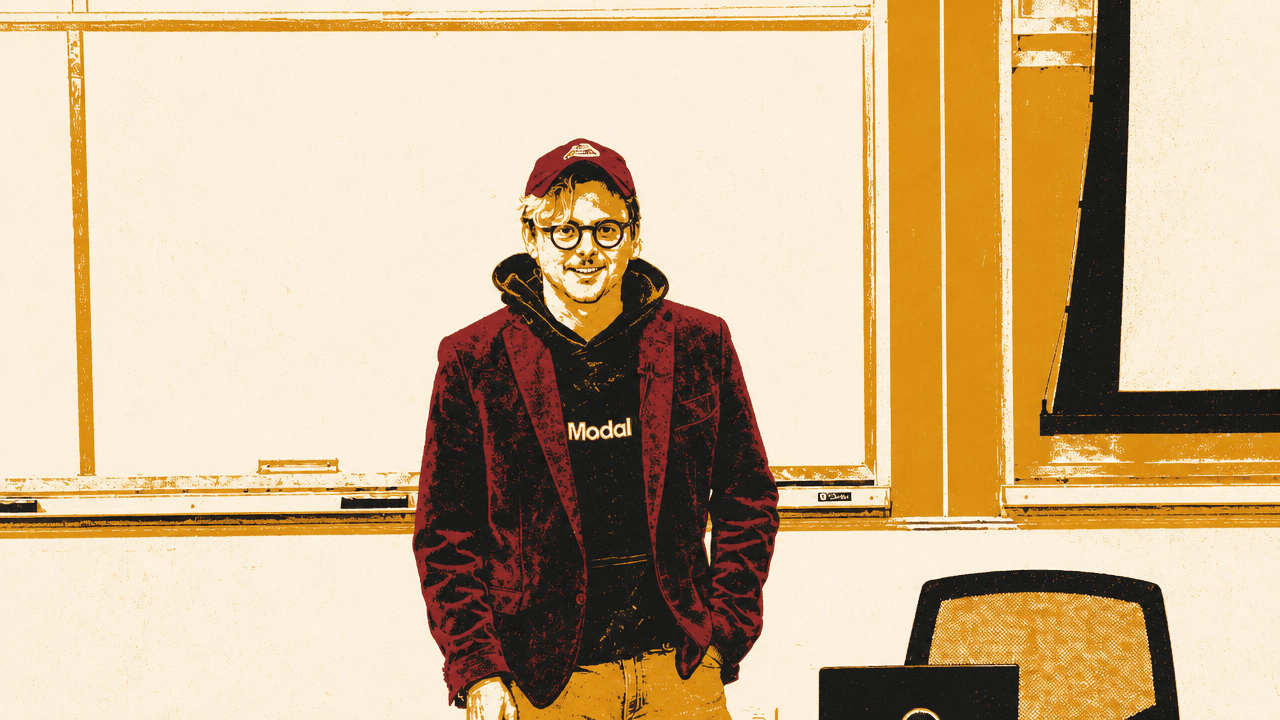
In a Stanford CS25 seminar, Modal’s Charles Frye argues that transformer inference has become the economic and operational center of AI systems: training produces weights, but serving turns them into usable, billable products. His account treats production inference as a full-stack problem, where application latency goals, workload shape, model choice, GPU memory limits, deployment failures, observability and cost controls all determine whether a system works. Frye’s main warning is that the largest serving gains come from matching the inference stack to the application, not from treating model hosting as a generic infrastructure task.
Inference is where transformer economics become real
Charles Frye’s core economic claim was simple: training produces weights, but inference turns those weights into something people can use and, in many cases, pay for. Weights alone are not obviously a business. They have to be wrapped in a system: an application, an inference service, operational guarantees, and enough cost control to make continued model development possible.
That distinction is why he called training a cost center and inference a revenue center.
Training is a cost center, inference is a revenue center.

Pre-training remains concentrated in a small number of organizations, especially at frontier scale. Inference, by contrast, is distributed across many teams and many applications, and Frye expects that distribution to keep widening. Even post-training now depends on inference: models generate outputs, interact with the world, and feed those results back into reinforcement-learning loops. Frye said this may now require more FLOPs than pre-training, though he added that he did not know whether people knew that yet. In his words, “even the training heads” have to care about efficient inference now.
What makes inference interesting to Frye is not just that it attracts money and demand. It forces engineers to reason across the whole stack. The application defines what latency and quality mean. The model and engine determine how work is scheduled. The GPU architecture determines where the bottlenecks are. Deployment choices determine whether scarce hardware is idle, overloaded, or failing. Debugging requires enough observability to diagnose both model behavior and hardware behavior from logs.
He described the current moment as one in which inference “straddles the stack” from applications to algebra to electrons: product behavior, workload definitions, tokenization, matrix multiplication, memory bandwidth, heat, cooling, and cloud allocation all matter at once. That breadth is also why inference choices expose training choices. A model architecture that is elegant in training can become expensive or awkward in decode. A tokenizer or chat-template bug can become a production-quality bug. A model that needs many GPUs per replica forces deployment and fault-tolerance choices that a smaller model avoids.
The demand side is unstable. Frye’s examples emphasized bursty application traffic, fast-growing AI products, and social distribution that can create sudden peaks. Inference systems cannot assume the calm planning rhythms of training clusters. They have to absorb demand that, in his phrasing, “kind of just happen[s] to you.”
The application archetype determines the metric that matters
Frye divided LLM applications into three infrastructure-oriented archetypes: chatbot-plus systems, background agents, and data processors. The categories were not meant as product taxonomy. They were a way to identify the engineering constraints that matter when serving the workload.
Chatbot-plus systems include familiar interactive uses: ChatGPT and Claude Code were his prototypes. A human is waiting on the other side. The system may do more than chat — it may use generated text to interact with tools or other computer systems — but the user experience is governed by human reaction time. For this class, the figure of merit is interactivity, which Frye described as tokens per second per user, mostly output tokens per second per user.
Background agents, such as coding or SRE agents, also act on behalf of users, but the human is not necessarily sitting there waiting token by token. A user might tag an agent during a meeting and expect a pull request, incident analysis, or design document later. These systems can tolerate latency measured in many seconds, minutes, or even hours, depending on the job. For them, Frye argued, the figure of merit is usually time to last token: the time until the useful artifact is complete.
Data processors, such as systems that process PDFs, emails, documents, or other unstructured inputs into structured data, have a different constraint profile. Frye cited Reducto and Fathom as examples, and mentioned Reducto’s indexing of Jeffrey Epstein’s emails for the Jmail project. In these workloads, the downstream consumer is often a database, file system, or later query path. They tend to be high-volume, less latency-sensitive, and bursty. The relevant figure of merit is megatokens per dollar.
| Application archetype | Prototype examples | Primary figure of merit |
|---|---|---|
| Chatbot+ | ChatGPT, Claude Code | Interactivity, tokens per second per user |
| Background agent | Devin, Resolve, Ramp Inspect, OpenClaw | Time to last token |
| Data processor | Reducto, Fathom | Megatokens per dollar |
Those distinctions feed directly into workload definitions and service-level objectives. Frye argued that the handoff between application stakeholders and inference engineers should be a concrete workload description: queries per second, tokens per query, prefix reuse, and latency budget.
Queries per second are controlled by users and are difficult to forecast. Seasonality and peak-to-average ratios matter because the higher the difference between average and peak load, the harder the system is to serve efficiently. Tokens per query are controlled partly by users and partly by the model. Input tokens drive the prefill phase; output tokens drive decode. Output length is especially annoying because the model decides when to emit an end-of-text token, and even deterministic settings can be difficult to reason about at the workload level.
Prefix reuse is another major variable. If the system has already seen some token prefix, previous computation can be cached. Frye described aggressive prefix or KV caching as a way to turn GPU computation into storage loads, often reducing cost at the expense of latency. It is especially useful when users have higher latency tolerance. Although users may write only short prompts, the actual prompts observed by models are often thousands of tokens after system messages, tool definitions, harness text, or other scaffolding. That means prefix reuse is partly under the control of the surrounding software.
Latency budgets split into time to first token and time per output token, also called inter-token latency. Time to last token matters too, but Frye said it is usually easier to reason about output length and per-token latency separately, then combine them. Tool calls complicate the picture because they introduce external latencies and feedback loops. For most user-facing applications, Frye emphasized that latency should be reasoned about per user or per request, not just as an aggregate machine metric.
The unit of analysis should also be one replica. A team may estimate total QPS from expected users, but an inference deployment will usually be served by multiple independent replicas. Frye’s method is to determine what one replica can handle while meeting its latency budget, then add replicas until aggregate demand is satisfied. Inference differs from some database systems because independent replicas can operate largely independently, apart from prefix caching.
Benchmark one replica before scaling the system
Charles Frye gave a simple recipe for benchmarking a single replica. First, estimate minimum latency by running queries one at a time and recording the reciprocal of mean latency. This approximates the fastest experience a user could get if every request had its own replica. Then estimate maximum throughput by dumping many queries onto the replica at once and measuring how quickly it finishes them all. That exposes maximum parallelism to the engine and hardware.
The two endpoints reveal a tradeoff. Sending one query, waiting for it to finish, and sending the next gives the shortest per-request latency. Sending all queries at once often completes the batch sooner overall, but any given request experiences higher latency. Frye compared this to measuring an impulse response in a system. Between those endpoints, engineers should sweep client request rates to observe how the replica behaves under realistic load.
Tail latency matters more than it initially appears. Frye used Modal’s token timing simulator to show why P95 or P99 token latency can ruin perceived output quality even when median latency looks fine. If a system measures token-level latency, a “rare” slow token can appear repeatedly during a long completion. One out of 20 tokens being slow is not a rare user experience in a 1,000-token generation; it is stuttering throughout the response.
That is why aggregate averages alone are not enough. For capacity planning, averages help compute throughput and right-size hardware. For user experience, medians and tails reveal whether output feels smooth or broken. The same measurement can be acceptable for a bulk data processor and unacceptable for an interactive chatbot.
Model choice splits between efficiency-bound and capability-bound workloads
Frye’s model-selection framework separated workloads into two regimes. In efficiency-bound workloads, model quality is good enough; cost-performance becomes the hard problem. In capability-bound workloads, the best available intelligence is still insufficient or close to insufficient; latency becomes the sticking point because the solution is usually to make the model larger.
In efficiency-bound settings, open models dominate in Frye’s account. These deployments are often single GPU per replica because the models are on the order of billions to tens of billions of parameters and fit into the VRAM of common accelerators. Multi-GPU replicas appear when latency budgets are tight, because splitting work across multiple memory pipes can remove latency bottlenecks. Frye said these workloads are often data processors, subagents inside background agents, and only rarely chatbot-plus applications. Voice agents may be an exception: they may not require frontier intelligence, but they do require very fast responses.
Efficiency-bound tasks also often involve multimodal inputs and structured outputs. The model may be used to turn unstructured information into structured information, a task that does not require “IOI medal winning intelligence,” as Frye put it. In this regime, teams have many open model families to choose from, with different sizes, modalities, and data mixtures. Frye’s examples included Qwen, Nemotron, GPT-oSS, Gemma, Step, and Mistral, but the operational point was the abundance of substitutable choices once capability is sufficient.
Capability-bound workloads look different. Frye argued that “we have only scaling as our solutions to high intelligence right now,” which means these models are usually too large for one GPU. His slide described them as always multiple GPUs per replica, with multiple nodes sometimes entering when the latency budget allows it; in speech, he qualified that around unusual hardware such as very large chips. They are often chatbot-plus systems or the orchestrator at the top of a background-agent architecture. Lower-level subagents can often be smaller and faster; the orchestrator usually needs the highest capability.
Tool calls are central in these systems. A capable model is useful because it interacts with the world, observes results, and acts again. That creates high prefix-reuse opportunities, but it also introduces tool-call latency ranging from milliseconds to hours. Frye said many teams begin with a proprietary API while developing the application, then later seek more control over inference. At that point, the open options are fewer; he named DeepSeek, Kimi, GLM, and MiniMax as examples, often meaning the largest and latest model from a provider.
He also noted that reinforcement-learning fine-tunes of open models have started to catch up in capability-bound settings, especially in the last three to six months. Fine-tuning can make switching models more constrained, however, because training software and tuned behavior are not yet as portable as inference engines.
Inference engines have become the handoff between CPU orchestration and GPU work
An inference engine is not just “the model runner.” Frye decomposed it into server I/O, tokenizer processes, detokenization, a CPU-side scheduler, and GPU model-forward passes. The server handles HTTP or RPC requests and metrics. Tokenization is CPU-intensive and often parallelized across processes, especially in Python systems. Detokenization is usually lighter because generated tokens arrive more slowly. The scheduler is the crucial CPU-side component: it defines and schedules work on the GPU.
The GPU is a coprocessor. The host gives it work and receives results later. The scheduler’s job is to keep it busy. Frye described this as the principle behind PyTorch eager mode: Python can be slow as long as it chooses the next kernel before the GPU finishes the current work. In his account, PyTorch has emerged as a common interchange point between CPU orchestration and GPU execution for these engines.
Frye identified three major engine options, but treated the differences less as a checklist than as operating cultures and fit. TensorRT-LLM, from NVIDIA, remains strong for small models and small batch sizes. Because it is a compiled C++ runtime, it has low host overhead, but development can be painful. NVIDIA still sometimes releases new techniques there, though Frye suggested investment may have shifted somewhat toward supporting open libraries around its hardware.
vLLM has the widest adoption in his view. It arrived early as an open-source, open-governance project and has a more compatibility-oriented, enterprise-flavored engineering culture. SGLang is also mature, but Frye characterized it as more performance-obsessed and startup-like. He described many Docker images, branches, and versions carrying small optimizations, in contrast to vLLM’s tendency to get more things into main.
Frye did not choose a single winner. As a consumer of engines, he said both vLLM and SGLang do strong work, and it is useful to have more than one credible option. His advice was not necessarily to write an engine, but to understand them. He recommended mini-sglang and nano-vllm as simplified implementations for learning architecture, Aleksa Gordic’s vLLM walkthrough, and Cognition’s DeepWiki as a queryable, diagrammed way to explore repositories. He also recommended pairing such tools with local code access and an agent.
Decode tends to be memory-bound, and current GPUs make that central
The hardware story begins with the split between prefill and decode. During prefill, the model processes input tokens: hundreds, thousands, tens of thousands, or more. The accelerator moves model weights from high-bandwidth memory into registers and does many floating-point operations. During decode, each generated token also requires moving the active weights out of memory and calculating with them. As a rough rule of thumb, Frye said that per batch element — per token per request — the system may do only on the order of two or three floating-point operations, such as multiplying and accumulating, for the bytes loaded.
That puts decode far below the ridge point in a roofline model. Recent NVIDIA GPUs have enormous arithmetic bandwidth, especially through tensor cores, but memory bandwidth has not scaled at the same rate. Frye showed representative ridge points in the hundreds to over a thousand FLOPs per byte depending on chip and precision, while decode may have much lower arithmetic intensity. The result is that the accelerator can be expensive and underused: the workload is often memory-bound, not compute-bound.
| System shown | Arithmetic bandwidth | Memory bandwidth | Ridge point |
|---|---|---|---|
| A100 SXM FP16 TC / HBM2e | 312 TFLOPs/s | 2 TB/s | 156 FLOPs/byte |
| H100 SXM FP16 TC / HBM3 | 989 TFLOPs/s | 3.35 TB/s | 295 FLOPs/byte |
| B200 FP16 TC / HBM3e | 2250 TFLOPs/s | 8 TB/s | 281 FLOPs/byte |
| H100 SXM FP8 TC / HBM3 | 1979 TFLOPs/s | 3.35 TB/s | 592 FLOPs/byte |
| B200 FP8 TC / HBM3e | 4500 TFLOPs/s | 8 TB/s | 562 FLOPs/byte |
| B200 FP4 TC / HBM3e | 9000 TFLOPs/s | 8 TB/s | 1125 FLOPs/byte |
In Frye’s experience, current production inference points strongly toward recent NVIDIA data center tensor-core GPUs, especially SXM systems. “Data center” matters because of HBM, power delivery, and interconnect. HBM gives high bandwidth and capacity, which are critical especially for decode. SXM allows full wattage and better integration than PCIe. NVLink and InfiniBand connect GPUs and nodes. Tensor cores matter because they are where almost all contemporary GPU FLOPs live, but they are matrix-multiplication units. Frye’s warning to model architects was blunt: do not design architectures that cannot exploit matrix-matrix multiplication.
He was skeptical of most alternatives for today’s high-end transformer serving, while leaving room for change. CPUs generally cannot provide acceptable latency for the desired models, in his view, because they lack HBM in typical deployments and do not give programmers the same control over L1/shared memory. He expects this to change as models get smaller and CPUs get bigger, but “not today.” He had less direct experience with AMD GPUs, but said he has heard programming and rated-performance challenges while noting strong work underway. TPUs and other inference chips raise, for him, single-supplier and installed-base concerns: fewer programmers, fewer deployment routes, and less of the broad hacker ecosystem that exists around NVIDIA GPUs.
Deployment is constrained by scarce GPUs, failure, and traffic variance
Because GPUs and HBM are scarce and expensive, Frye argued that inference is currently mostly served remotely rather than locally. He expects some inference to move outward over time, comparing the eventual edge/local split to the difference between SQLite and Postgres. For now, though, most applications run in cloud or data-center deployments on behalf of clients.
Network latency eats into chatbot-plus budgets. Regional deployments may add on the order of 10 milliseconds; global deployments may add on the order of 100 milliseconds. That pressure pushes systems toward more complex regional or edge-in-the-data-center designs when latency is tight.
Hardware failure is another constraint. Frye showed a comparison in which CPUs had mean time to failure around 2,800 years, SSDs around 100 years, and NVIDIA H100s around 50 days, corresponding on the slide to annual failure rates of about 0.01%, 1%, and 700%, respectively. The comparison should be read as the lecture’s operational framing, not as a general audit of all deployments. Frye compared GPU operations to older war stories about spinning disks: engineers must assume failure and build redundancy so hardware faults do not become user-visible system failures.
Inference handles this better than training because replicas are independent. A training job may require all GPUs to be up at all times or the whole job stops. An inference system can route around a failed replica. But failures still affect reliability, robustness, and cost-performance. Frye pointed to Modal’s work tracking Xid errors across thousands to low tens of thousands of GPUs and noted that failure rates differ significantly across cloud providers and deployments.
The larger operational problem, in his view, is traffic variability. Inference demand swings with product growth, seasonality, social distribution, and unpredictable bursts. A fixed, over-provisioned GPU allocation wastes money off peak. But slow allocation misses demand spikes and leaves quality of service degraded. The goal is fast automatic allocation that tracks application demand closely enough to keep both utilization and QoS high.
| Allocation pattern | Resulting problem |
|---|---|
| Fixed over-provisioned GPU allocation | Low utilization when application demand is below peak |
| Slow allocation | Missed peaks, lingering unused GPUs, and degraded quality of service |
| Fast automatic allocation | Higher utilization while preserving quality of service |
The concrete mechanisms Frye described were Modal-specific demonstrations rather than a general reference architecture. Modal’s approach includes keeping a cloud buffer of idle machines rather than starting from scratch when traffic arrives. In a multi-tenant environment, that requires deciding how much buffer to keep and which instance types to launch across cloud providers while considering cost and scaling limits. He described this as an operations-research-style linear solver problem.
Fast startup also requires controlling file-system and application startup costs. Frye described Modal’s use of lazy container file-system loading while eagerly fetching the first files likely to be needed, such as Python, PyTorch, and core operating-system libraries, through a multi-tier cloud cache from page cache and SSD through cache servers, CDN, and blob storage. For application startup, engines such as SGLang and vLLM may spend minutes on just-in-time compilation, CUDA graph capture, and torch compilation. Frye’s argument was that a process is “just a data structure in the end”; if it can be checkpointed and restored faster than recreated, technologies such as CRIU and CUDA checkpoint can reduce startup time. TCP sockets and similar resources require surgery, but the underlying idea is data restoration rather than recomputation.
Observability means being able to debug from logs
Frye defined observability as the ability to debug just from logs. The ideal is to inspect what the system recorded, identify what went wrong, fix the code, and ship, rather than reduce a distributed production failure to a minimal repro. He connected this to Charity Majors’s framing of observability as dual to controllability or steerability.
He grouped inference bugs into application-level bugs, model-quality bugs, and performance bugs. Application-level bugs are shared with application developers and stakeholders, and may cross machine-learning behavior, correctness, and user experience. Model-quality bugs include train-serve skew, but Frye singled out tokenizer and chat-template bugs as especially common in newly released open-source models. Tokens, he said, are “cursed,” and the complexity of templates and special tokens has increased over time. These bugs are usually beaten down after release, and he framed tokenizer bug discovery and fixes as valuable open-source contribution work.
For tokenizer debugging, his advice was specific: log token IDs, not only strings. Unicode-level symptoms can be subtle; token IDs can make the bug obvious. For model quality more broadly, teams should run evaluations before deployment, log traces, and log user feedback.
Evals, in Frye’s framing, are like tests: thankless, annoying, style-cramping, difficult, time-consuming, and low-status, but critical. They do not have to begin as a full platform; a notebook or spreadsheet of prompts can already help. The important property is that they become model-agnostic enough to guide application and workload decisions: which model to use, how much to quantize, whether a fine-tune is acceptable, whether a speculative model or optimization changed behavior too much.
Models and deployments are temporary. Evals are forever.
For performance, Frye’s rule was to log more metrics than seems necessary. He listed time to first token, time per output token/inter-token latency, time to last token, requests per second, queries per second, queuing, prefill, cached prefill, decode, per-replica and aggregate views, and p50, p95, p99, and averages. Request-level and LM-query-level measures should be defined separately, especially when tool calls generate additional model invocations.
Queues deserve special attention. Frye said many systems contain queues from GPU SMs up through ingress, and these often drive tail latency. If time to first token or time to last token rises, there is probably a queue somewhere. Prefix caching should also be measured, including the actual hit rate and, for advanced analysis, offline estimates of the optimal hit rate under perfect caching.
Hardware metrics matter too: GPU temperature, power draw, kernel utilization, memory utilization, and low-overhead asynchronous indicators. Frye cautioned that lower-level performance counters often impose unacceptable overhead in production, so power and temperature can serve as free first signals. In one Modal dashboard example, P95 and P99 latency spikes correlated with queuing, suggesting that some requests were being cycled out and back in by the engine’s fairness scheduling. That could mean too many requests per replica or slower replicas, but in that particular art-show deployment the performance was acceptable enough that he did not fully debug it.
The biggest performance wins come before kernel work
Frye’s performance-optimization hierarchy starts with speculative decoding and quantization, then host overhead, and only then GPU kernel optimization. Kernel work matters at very large scale, but he argued that engineers should not start there when larger levers remain.
Speculative decoding addresses the decode problem directly. Decode is often memory-bound: the system uses memory bandwidth but leaves many FLOPs unused. Speculation gives those unused FLOPs something to do by drafting possible future tokens with another model, then checking them with the target model. Frye described this as using a Metropolis-Hastings-style rejection-sampling algorithm that preserves the target model’s output distribution under the speculative decoding setup. In greedy decoding, the intuition is simpler: accept the matching prefix from the draft and fall back to the target model at the first disagreement.
The speedup depends heavily on acceptance length. Frye said speculative decoding can yield measured speedups of 2x, 4x, or 8x, and that application-specific data can improve a custom speculator from roughly 2x to 6x in favorable cases. That difference can decide whether an application works at all. He described this as “bitter lesson” aligned: better draft models come from more data and compute, just like base models.
Speculation methods vary. N-gram speculation repeats token sequences from the prompt. Multi-token prediction builds several next-token heads into the model and is becoming more standard in newer releases. EAGLE-style methods train a draft model from hidden states, including earlier hidden states that may carry broader upcoming ideas before the model sharpens into next-token prediction. DFlash, which Frye said Modal is excited about, is similar to EAGLE but uses a denoising diffusion language model. Frye argued diffusion language models are a better hardware fit because they have higher arithmetic intensity and avoid the same prefill/decode split, even if they have struggled to reach highest standalone capability.
Quantization is the other largest lever. Moving from FP8 to FP4 can be about a 2x speedup in Frye’s description, both for memory-bound and compute-bound paths: fewer bytes reduce memory-bandwidth demand, and tensor-core operation rates scale with precision. But quantization requires full-stack coordination. Hardware must support the format — Frye said FP4 acceleration requires Blackwell in NVIDIA’s stack — and the application must tolerate changed model behavior. Longer input or output sequences are riskier because lower precision accumulates more error. Frye said FP8 is standard on Hopper and above, while FP4 remains cutting edge. Attention is harder to compress than MLP or MoE matmuls, though matmuls are often the bottleneck. KV-cache quantization or compression is harder still and, in Frye’s view, should generally be addressed at train time.
After speculation and quantization comes host overhead. The rule is simple: never block the GPU. CUDA graph capture is one key technique because it turns many kernel launches into one and reduces CPU scheduling overhead. GPU power draw can reveal whether a replica is underfed by the host. Frye showed an example of one slower replica drawing only 2 kilowatts instead of the “3 kilowatts plus” he said it should have been able to draw, suggesting the slow one was not actually saturating the GPU.
Profilers can help, but Frye warned that simple tools are often enough. NSight Systems and Torch Profiler can expose stragglers in collectives; he suspected NUMA affinity issues in one live debugging case. But Modal also found a more than 10% multimodal inference improvement in SGLang with py-spy and a Python dictionary: caching an IPC pool handle rather than recreating it for every tensor on every request.
Only after those layers should engineers consider kernel optimization. Frye said many kernels are already close to “speed of light” because NVIDIA, DeepSeek, Tri Dao, Jay Shah, and others release highly reusable kernels and libraries. He named CUBLAS, cuDNN, CUTLASS, FlashInfer, DeepGEMM, and FlashAttention as examples. NSight Compute can measure low-level utilization and map stalls to C++, PTX, or SASS, but he also emphasized that fast kernel work begins with feeds-and-speeds reasoning on a whiteboard. Before using fancy tools, understand which hardware block is the bottleneck and what speed it can theoretically sustain.
The next serving stack will be lossier, more automated, and less general-purpose
Frye’s forward-looking claims centered on three shifts: more “unhinged” lossy optimizations, megakernels, and weirder hardware.
Lossy optimizations become more plausible as teams move from shared model providers to single-application deployments. If one application defines correctness, the inference stack can take risks that a general-purpose provider cannot. Frye listed lossy speculative decoding, heavy quantization, layer skipping, and pruning as examples. These optimizations require evals because the question is not whether they preserve general model behavior; it is whether they preserve the application’s definition of acceptable behavior.
Megakernels may first appear for draft models or specific layers, such as DSV4 MegaMoE-style work named on Frye’s slide, and later for whole models. The motivation is to reduce overhead and fuse more of the execution path when the deployment is specialized enough.
Hardware may also specialize, though Frye presented this as a watch-this-space area rather than a settled roadmap. His slide referred to “NVIDIA VR LPX ASICs” and compared the space to cryptocurrency blockchains, but the acronym was not expanded in the source. In speech, Frye said NVIDIA would be releasing a hybrid rack in the next generation that includes LPUs from Groq; given the transcript’s uncertainty and the slide’s ambiguity, the safer reading is simply that he expects more specialized accelerators to enter the serving stack. He added that current systems do not yet map cleanly onto the prefill/decode split, but he expects that, if demand continues, prefill and decode may eventually be handled by distinct accelerators. He also gestured toward more speculative possibilities such as analog, optical, or memristive computing for extreme token-throughput futures.
The software-engineering process itself may become agentic. Frye did not present this as “prompt and walk away.” Instead, he argued that engineers will build the systems that define and measure correctness for agents. Near-term agents may help with benchmarking, configuration, and on-call workflows, but only if they have clear measures, metrics, and tools. Over time, if bespoke engines become cheap to generate, the current assumption behind general engines such as vLLM, SGLang, and TensorRT-LLM may weaken. Frye pointed to VibeServe, from the Han lab, as a gesture toward per-deployment generated serving systems.
He closed with the idea of CI/CL: systems that automatically improve quality, robustness, and performance over time. Automated speculator retraining could lead into automated distillation and continual learning. The loop he described was not just more users producing more data. It was a system that uses that data to improve models, improve UX, and then attract more use. In that version of transformer serving, inference is not merely the last step after training. It is the operational layer where product use, model improvement, and hardware economics continuously feed one another.