Gigabyte-Scale Agent Traces Are Forcing a New Observability Stack
Phil Hetzel of Braintrust argues that agent observability is a different problem from traditional observability because the central question is no longer whether a system is up, but whether an agent did the right thing. In his account, agent traces are too large, textual, and semantically loaded for uptime-oriented monitoring systems: Braintrust has seen traces exceed a gigabyte and spans reach 20 megabytes. Hetzel says that shift also changes who uses the data, bringing clinicians, lawyers, wealth advisers, and other domain experts into trace review so their judgments can become inputs for automated scoring and evaluation.
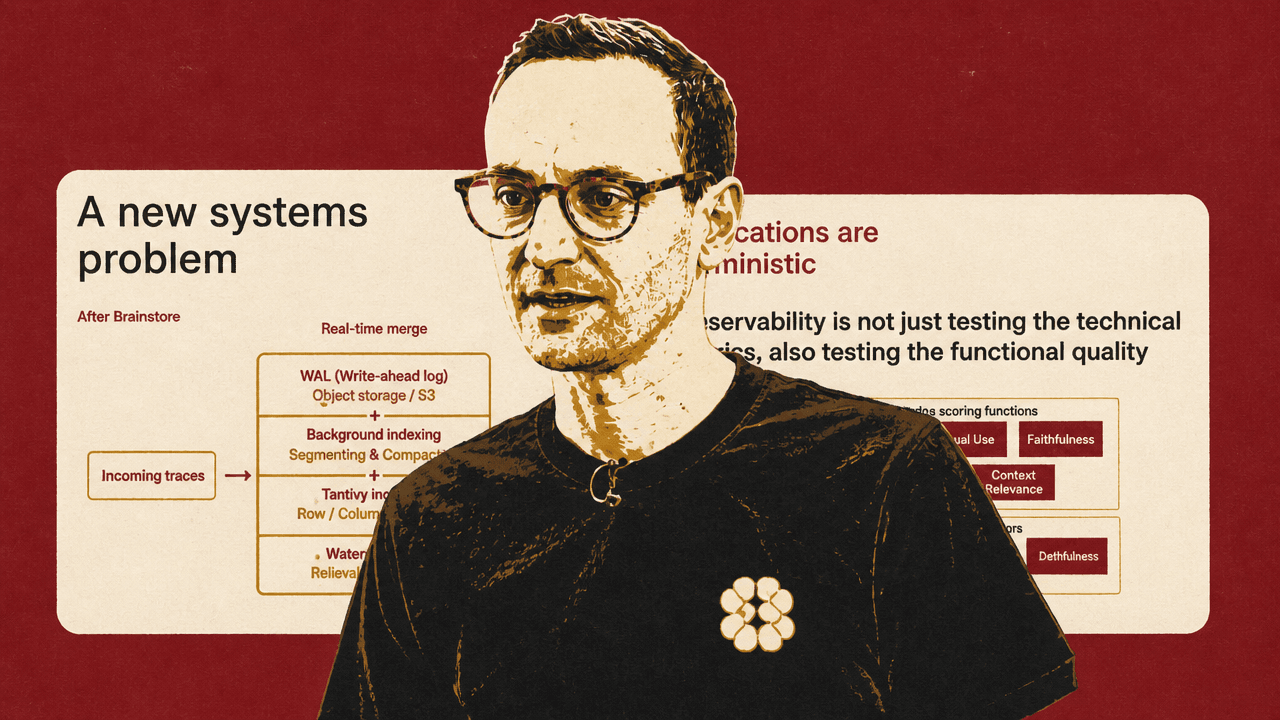
Agent observability asks whether the agent did the right thing, not just whether the system stayed up
Phil Hetzel draws the line between traditional observability and agent observability at the question each one is built to answer. Traditional observability is primarily about operational status: uptime, technical performance, bugs, computational cost, latency, error counts, throughput, and 400- or 500-level errors. It asks whether the system is operational and whether the user experience is technically acceptable.

Hetzel is careful not to dismiss that stack. Braintrust, he says, is itself a happy Datadog user for understanding whether users are running into website errors. Grafana, Datadog, and similar tools are well established because they solve a real and necessary problem for applications at scale.
Agent applications add another class of question. It is not enough to know whether an agent responded quickly, avoided an HTTP error, or completed a workflow. Teams need to know whether the answer was grounded in the right context, whether the agent used the tools it was expected to use, whether the response aligned with the brand standard encoded in the system prompt, and whether the agent performed well according to the quality definition of the application.
Traditional observability and agent observability still share basic building blocks. Metrics are values to measure and aggregate, such as latency, error count, and throughput. A trace is the full interaction for a workflow. A span is one step inside that interaction. But the same vocabulary hides a different problem. In a conventional application, the trace generally records deterministic code paths and technical measurements. In an agent application, the trace has to support judgments about behavior, reasoning, tool use, factuality, tone, and task completion.
Traditional observability is meant to measure deterministic metrics and codepaths.
That distinction matters because LLM-based systems are useful precisely because they are not narrow deterministic programs. The reason people “love LLMs so much,” in Hetzel’s framing, is that they have high variety: they can do many different things and abstract over the task. A typical application may contain control flow, but given an input it is expected to traverse a known path. An agent may take different paths, and the team may care deeply about why it chose one path rather than another.
Braintrust describes itself in Hetzel’s slides as an “agent quality platform.” It looks at quality in two directions: whether a production agent is performing as well as the team expected, and whether the team can become confident in new versions as it experiments with changes. The related production question is not only “are bad responses reaching users?” but whether monitoring can track live model responses and alert when quality drops or incorrect outputs increase.
The data shape breaks assumptions from traditional observability
The most concrete reason Hetzel gives for treating agent observability as a distinct problem is the size and texture of the traces. Agent traces are “nasty,” he says: highly semistructured, with large amounts of unstructured text inside that semistructure. They can also be very large. Braintrust has seen customer agent traces exceed a gigabyte, according to Hetzel, and individual spans reach 20 megabytes.
The trace he shows from Braintrust’s customer-service demo illustrates why those traces carry more than operational metadata. The interface includes rows of conversations with fields such as user, expected response, tags, sentiment, and duration. Opening a trace reveals model, token counts, cost, tool use, classifications, brand alignment, escalation, issue resolution, and the underlying prompt instructions. The visible system prompt describes a customer-service assistant for a buy-now-pay-later service, with instructions to check account balances, explain orders, handle payment issues, process refund requests, and answer product questions. It also includes behavioral rules: be friendly, professional, and concise; always use available tools for real-time information; format amounts and dates clearly; explain tool failures; confirm sensitive actions; and connect to a human when the agent cannot help.
That is the kind of data traditional observability systems were not designed to ingest, process, and use. A trace is no longer merely a record of functions and timings. It contains the natural-language inputs, model outputs, system instructions, tool calls, labels, judgments, and classifications needed to decide whether the agent behaved correctly.
The speed requirement does not relax just because the trace is larger. Hetzel says agent observability data is “just as fast as traditional observability data.” If an agent gets product-market fit and attracts heavy usage, the AI engineer or product manager still expects to see live behavior in real time. Braintrust hears a recurring customer request: make it faster.
This creates two simultaneous read patterns for Braintrust’s system. First, the platform must support fast ingest and immediate visibility, so that when someone interacts with an agent, the trace appears essentially instantaneously. Second, it must support analytical and programmatic querying, including users firing SQL commands through a CLI to incorporate observability or evaluation traces into automated improvement workflows. Hetzel describes this as a proliferation of mediums for querying very large trace shapes.
Braintrust built a database around traces that are large, textual, and queried in real time
Phil Hetzel says Braintrust designed a database from the ground up for agent traces. He does not present this as a universal architecture every team must copy, and he does not go deeply into implementation in the talk. He identifies the main requirements Braintrust had to satisfy. Incoming traces must go into a write-ahead log so users can see them immediately. Background indexing is needed so filtering and analytical queries stay fast. Object storage, segmenting, compacting, and unified query planning all sit behind the user-facing experience of streamed results to the UI.
A central part of Braintrust’s implementation is full-text indexing. Braintrust uses what Hetzel calls a Tantivy index. When an audience member asks whether Tantivy is like OpenSearch, Hetzel says it is most similar to Apache Lucene, except written in Rust. Braintrust forked the open-source framework.
The need for text indexing follows directly from the trace content. If a trace contains large bodies of natural language, a useful workflow is to ask for every trace that mentioned a specific word — Hetzel’s example is “Amazon.” That is difficult unless the platform performs full-text indexing across traces. Traditional observability, he says, generally does not require teams to think about that kind of text problem.
The database question comes up again in Q&A, when an audience member asks why Braintrust did not use an OLAP database such as ClickHouse. Hetzel says Braintrust used to use ClickHouse and moved away from it. The substantive answer is that the workloads needed more text-based indexes than ClickHouse could provide, at least at the time, so Braintrust built its own.
The result, as Hetzel describes Braintrust’s system, is not a conventional observability store with a few AI-specific fields added. It is organized around a hybrid workload: real-time trace ingest, analytical filtering, SQL or SQL-like query access, and full-text search over large semistructured and unstructured records.
The users of agent observability include domain experts, not only engineers
A second difference is the audience for the traces. Traditional observability is used primarily by technical roles: systems engineers, product engineers, and others responsible for application reliability and performance. In a medical application, Phil Hetzel says, the traditional observability user is probably not the clinician or registered nurse. The work is about technical performance, bug discovery, and avoiding 400- or 500-level errors and poor customer experiences.
Agent observability, if done well, brings in nontechnical people. Hetzel says the best teams building agents include both technical and nontechnical participants because the nontechnical people are often closest to users or closest to the problem space. Prompts and agent behavior can be evaluated in natural language, which lets those experts contribute directly.
He gives examples from Braintrust customers: clinicians, registered nurses, wealth advisers, and lawyers reviewing traces and using what they see to improve agents. That workflow, he says, simply does not appear in traditional observability, where the central concern is uptime.
The importance of human annotation becomes clearer in response to an audience question. Asked to explain the “human annotation” portion of his platform slide, Hetzel gives the example of a trace that a product manager reviews to decide whether the agent did a good job or a bad job. The grade matters, but so does the explanation. The expert’s justification captures why the agent failed or succeeded.
Those written justifications then become material for scalable evaluation. Hetzel says teams will likely run an LLM over them and use them to create more scalable scoring functions. Human annotation is not just manual review in this workflow. It is a way to discover failure modes and convert expert judgment into automated scores.
That is also why Braintrust treats observability and evals as closely related. Hetzel says Braintrust thinks of observability and evaluations as the same problem. The difference is operational: with evals, the team knows the inputs ahead of time and runs them in batch; with observability, the inputs are unknown ahead of time and arrive in real time.
Production traces become the raw material for offline improvement
Phil Hetzel’s account of agent observability is not limited to watching production behavior. The operational loop is that traces from real users can be turned into offline datasets, rerun as evaluations, and used to test whether proposed changes improve the agent. Production monitoring supplies the failures; offline experimentation gives teams a repeatable way to work on them.
An audience member asks how Braintrust integrates with other agentic frameworks to close the loop for offline optimization, including experiment functionality and something like a semantic router. Hetzel answers that once a trace comes in, the team can add it to an offline dataset and experiment on it. He apologizes for making the answer product-specific, but the workflow he describes is specific: production inputs can be moved into offline datasets and rerun in evaluations.
The same point appears in the slide comparing technical and nontechnical team members. Nontechnical users are not only uncovering failure modes and judging traces. They are also implementing agent quality checks and “rerunning” production inputs in offline evaluations. In Braintrust’s framing, the production trace can become a test case.
This reframes Braintrust’s eval platform as more than a dashboard of scores. Hetzel’s iceberg slide puts visible pieces such as agent, prompt, and model evals; a UI to see outputs; input examples; and human annotation above the waterline. Underneath are the supporting capabilities: prompt store, testing, observability, prompt playgrounds, online scoring, custom trace views, alerting, specialized database, governance, agent playgrounds, agent-forward workflows, model gateway, and topic modeling.
His point is that teams often underestimate the depth of infrastructure required to support this loop. The complexity comes from the data, the required speed, the types of people involved, and the need to turn production behavior into repeatable improvement work.
Scores handle known failure modes; topic modeling searches for unknown ones
Phil Hetzel distinguishes between scoring known quality checks and discovering patterns the team did not know to ask about. Braintrust’s slides show familiar evaluation categories such as tone, politeness, completeness, and accuracy. In Q&A, when asked whether Braintrust always measures quantitatively or also produces qualitative prose, Hetzel says there is an online scoring piece for “known unknowns,” where a score can be attached to a defined concern.
But he also points to a more open-ended mode for “unknown unknowns.” Braintrust has started to use lightweight LLM processing on incoming observability traces to perform embedding and clustering. The goal is topic modeling: grouping traces by how people are using the agent, what their intent is, how they feel about the interaction, and what issues they may be encountering.
In the product screenshot Hetzel shows, an “AI Insights” panel groups customer-service traces into topics. The visible examples include “Credit balance and utilization” with 30 traces, or 43%; “Failed payment verification” with 17 traces, or 24%; “Refund requests” with 10 traces, or 14%; “Installment plan adjustments” with 5 traces, or 7%; and “Order information and status” with 5 traces, or 7%.
| Topic | Trace count | Share |
|---|---|---|
| Credit balance and utilization | 30 | 43% |
| Failed payment verification | 17 | 24% |
| Refund requests | 10 | 14% |
| Installment plan adjustments | 5 | 7% |
| Order information and status | 5 | 7% |
The question customers naturally ask is simple: if Braintrust is collecting all these agent traces, and the traces contain valuable data, can it tell them how people are using the agent? Hetzel says simple questions often require complex systems behind them. Braintrust had rolled this capability into its software-as-a-service offering about a month before the talk.
The purpose, in Hetzel’s description, is to shorten the iteration loop between a production problem and the experiment used to fix it. Quantitative scores remain useful for known criteria, but Braintrust’s topic modeling and AI-generated insights are meant to surface categories of use and failure the team may not have specified in advance.
Technical observability remains necessary, but it is only part of the agent problem
An audience member frames Braintrust as focused on “functional observability” for agents and asks whether traditional observability remains appropriate for nonfunctional performance. Phil Hetzel accepts the framing. Traditional observability can handle technical observability, he says, while Braintrust focuses on the quality of the agent as defined by the team.
At the same time, tracing an agent automatically yields some technical metrics. Hetzel says prompt duration, time to first token, cache hits, and similar measurements “come on the house” when the application is traced. Agent observability does not discard conventional metrics. It incorporates them, but they become a subset of the problem rather than the whole scope.