Telemetry Files Turn Coding Agents Into First-Response Investigators
Jason Lopatecki of Arize argues that the constraint on agent-driven software repair is no longer generating code but assembling enough production evidence to trust a fix. His proposed loop has agents retrieve traces, logs and evaluations into the repository as files, investigate the execution path that actually failed, and produce a pull request for human review. The model shifts engineers from initial incident response toward review, though Lopatecki says larger changes still require human direction.
The bottleneck is no longer writing the fix
Jason Lopatecki argues that coding agents have changed the economics of producing code without yet changing the economics of improving a running system. An engineer can now generate a patch in minutes, but the surrounding work still takes much longer: find the relevant traces, inspect logs and evaluations, reconstruct the execution path, form a hypothesis, and decide whether the proposed fix is actually safe to ship.
That investigative work is what keeps a human in the middle. In Lopatecki’s framing, the problem is not that agents cannot write a one-line correction. It is that a system does not hand them the evidence needed to distinguish the relevant code path from the many paths the software could have taken.
Telemetry is that evidence. Traces show what happened in an execution: inputs, outputs, latency, errors, and the path through the system. Evaluations add a judgment about whether the behavior was acceptable. Together, they become the material an agent reasons over before it starts modifying code.
The proposed shift is to invert the usual debugging loop. Rather than having a person wake up, open a dashboard, identify an issue, assemble context, and then ask an agent for a patch, an agent should begin the investigation itself. It can produce an issue with supporting evidence, propose a change, and in the best case open a pull request. The person’s role moves from first responder toward reviewer.
The bottleneck is not the fix. It's building the evidence and confidence in the fix.
Lopatecki does not describe this as fully autonomous software repair today. For larger changes, he expects a human to steer the investigation and take the work “over the line.” But even then, the gain is the cold start: an engineer begins with traces, a diagnosis, and perhaps a proposed diff rather than an unexplained alert.
An agent needs more than an error signal
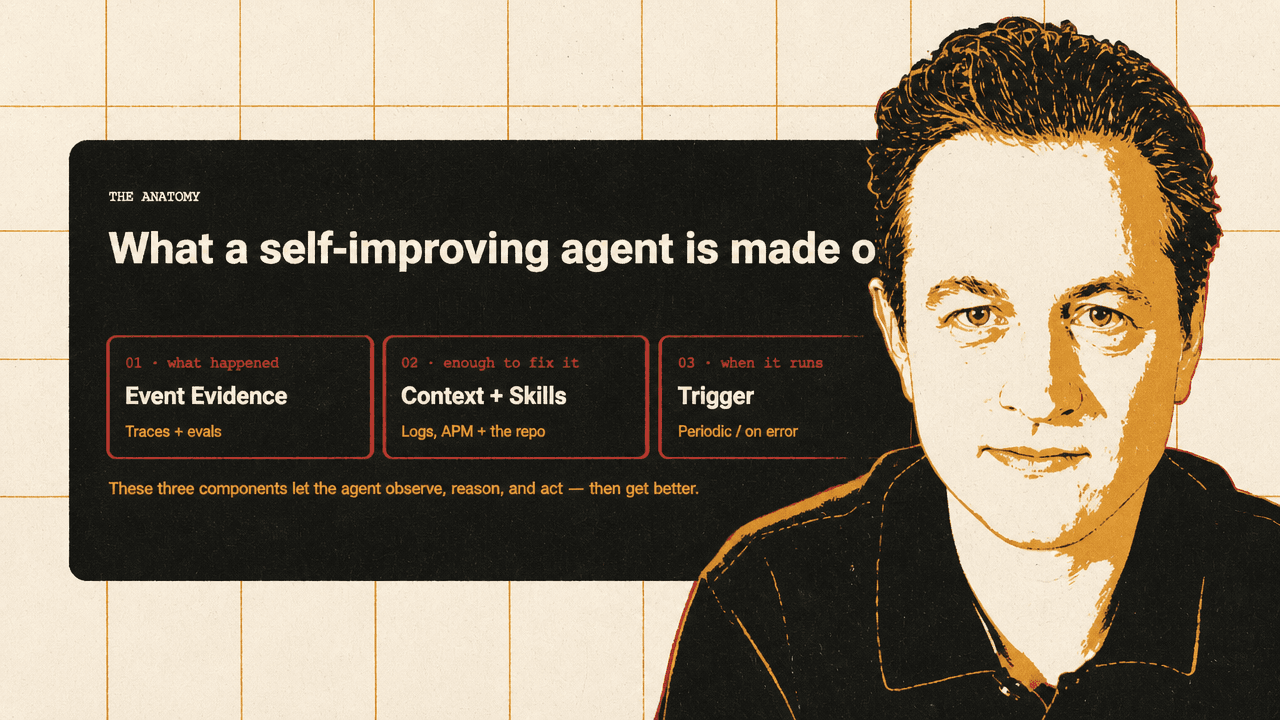
The operating model has three parts: evidence about what happened, context sufficient to make a correction, and a trigger that decides when to run the process.
| Element | What it provides | Examples Lopatecki gives |
|---|---|---|
| Evidence | A record of the execution and an assessment of its result | Traces, logs, evaluations |
| Context and skills | The working material and tools needed to investigate and modify code | Repository, APM data, observability skills |
| Trigger | A condition that starts the investigation | Scheduled sweep, errored trace, metric threshold |
The evidence layer begins with traces and logs. An error can trigger an investigation immediately, while a scheduled process can sweep recent executions and evaluations for failures, latency problems, or patterns worth fixing. Traces constrain the search: they show the path the system actually took, rather than leaving an agent to infer which of many possible branches caused the failure.
The context layer goes beyond the trace itself. The agent needs the repository where the correction will land, production logs or APM data that may explain the failure, and skills that can fetch and organize information from those systems. The target is a usable working set: relevant production evidence, the associated code, and tools for further investigation.
Triggers can be periodic or event-driven. A scheduled process might run nightly, hourly, or near real time to batch issues worth investigating. An event-driven process can begin as soon as a span fails. Arize showed an automation for investigating failing traces that begins when a custom query.error metric exceeds a threshold, looks back 15 minutes, and evaluates every minute. The intended output is an investigation that can proceed to a code proposal, not just an alert.
The practical unlock is telemetry as files in the repository
The critical implementation detail, in Lopatecki’s account, is mundane: pull the relevant traces and logs into the repository as files.
He says coding harnesses such as Claude Code work extremely well with files, while simply pointing them at a dashboard or a large undifferentiated body of data is not enough. A well-designed skill must identify the appropriate group of traces—perhaps activity associated with a session—retrieve it, and put it into a format the harness can inspect alongside source code. In some cases, he says, those trace files are about 10 megabytes.
These harnesses are magical with files.
This changes what a debugging skill is responsible for. It must do more than connect an agent to an observability platform. It needs to expose the right investigative surface area: ways to find an affected cohort, inspect traces around an incident, retrieve logs, or isolate a problem by customer or another dimension.
Lopatecki uses Pyroscope as an example. A skill might help an agent investigate memory problems, use facets in the system, or cohort behavior by customer to determine whether one customer is associated with an issue. The agent can compose those skills as the investigation develops.
His answer to the question of why teams should not simply connect Claude Code to their data and let it push a PR is essentially that they should—but that “connect” conceals the difficult part. The skill and data interface have to be designed so the agent can find the right evidence and use it productively. A model pointed at raw telemetry is not the same as an agent supplied with the relevant execution record, repository context, and composable investigation tools.
A cancelled stream produced a narrow repair
Jason Lopatecki illustrates the loop with an issue in Alyx, Arize’s in-product assistant. Alyx uses todo_update calls to manage its task list. In the trace shown, repeated updates to an item already marked in_progress accumulated until the system exhausted its budget and cancelled the stream.
The diagnosis was a retry loop. The system kept sending an update it did not need to send: the item was already in progress, yet todo_update continued retrying it more than 10 times.
The proposed patch was correspondingly small. In router/todo.py, the agent added a guard that returns immediately when the item’s status is already in_progress, preventing another update and retry cycle.
This is the ideal kind of case for the approach: the trace makes the behavior legible, the relevant repository location is clear, and the correction is narrow enough for a person to review as a single diff. Lopatecki explicitly cautions that not every failure looks like this. Bigger changes are more likely to require a human to direct the work. The example establishes a nearer-term operating model: evidence leads to investigation, investigation produces a pull request, and a person reviews rather than spends the night reconstructing the incident.
Your job moves from first responder to reviewer.
Evals turn known failures into recurring signals
Jason Lopatecki treats evaluations as production evidence layered onto traces, rather than as a separate testing process. An agent can retrieve both the raw execution record and the assessment attached to it.
He describes first-generation evals primarily as LLM-as-a-judge checks, alongside code checks. They turn raw runs into judgments such as pass, fail, correct, or unsafe. In the financial-agent example, Arize surfaced issues including absent safety checks, risk guidance that contradicted intended behavior, and a guardrail that detected harmful content but allowed the response pipeline to continue.
The important operational use is recurrence. Teams often create an evaluator after encountering a failure they want to catch again: prompt injection, a familiar unsafe response, or a repeated defect in how an agent responds. Once added, that evaluator can run over later production traces and identify the same pattern at scale. Lopatecki calls these online evals because they are layered onto production activity rather than reserved for an offline test set.
Arize showed an annotation attached to a trace of a financial agent. It marked the agent’s handling of an emergency-fund situation as correct and included the reasoning for that judgment. Skills can retrieve those trace-level assessments as well as aggregate evaluation results across many traces, giving an investigating agent both an individual failure record and a view of whether the pattern is widespread.
Lopatecki expects instrumentation to increase under this model, not diminish. Humans often treat exhaustive logs as noise because they cannot inspect all of them. Agents can retrieve, group, and reason over much more of the record. He expects teams to trace and log “10 times more,” potentially recording far more of each software instance’s behavior because that detail identifies the route software actually took.
The loop improves only to the extent that its evidence improves. A recurring failure can become an evaluator; an evaluator makes subsequent occurrences easier to detect; and the resulting evidence can support a more targeted investigation.
Deployment choices determine what the agent can safely investigate
Jason Lopatecki recommends starting with a local workflow. An engineer runs a coding agent on a laptop, validates the prompts and skills, and determines whether the agent can investigate a problem usefully. Only then does the same setup move to an unattended sandbox, where a schedule or event trigger can launch it without someone starting a session manually.
That progression preserves choices that matter in production. Teams select the harness that runs the agent, the sandbox in which it executes, the skills through which it reaches operational data, and the repository access through which it can propose a fix. Lopatecki named Claude Code, Codex, Cursor, and OpenCode as possible harnesses. He named Daytona, Claude-managed environments, Vercel, Modal, and Arize’s own environment as potential sandbox choices.
The runtime boundary is especially important when investigation requires access to production databases, logs, or other sensitive systems. Lopatecki says some customers do not want to connect production systems to Anthropic. Arize can be deployed in a customer VPC, and he cited Uber and Booking as examples of companies with requirements of that kind. Customers can alternatively use another sandbox provider with which they are already comfortable.
Signal is Arize’s background agent for periodically identifying issues in traces and connecting those issues to repository work. It is available in AX, Arize’s SaaS platform, which can also run in a VPC. Phoenix is Arize’s open-source offering. The product allows teams to configure an agent preset with a harness, sandbox, skills, linked repositories, and prompts that shape the agent’s mandate—for example, whether it should seek security issues or investigate less aggressively.
The platform also showed operators defining automations, monitoring a group of agents, opening an individual session, downloading its transcript, and resuming a Claude session locally. Those capabilities support an approval boundary rather than eliminating one: an organization can let an agent investigate continuously while retaining control over where it runs, what it can access, what it is asked to look for, and whether any proposed change is merged.
For an engineering leader, adoption turns on practical readiness. The relevant telemetry and evals must be accessible; skills must retrieve that material in a form the harness can use; the sandbox must satisfy security and data-access requirements; and the organization must decide which fixes can stop at a proposed PR and which still require a human to drive the work forward.