State-of-the-Art AI Models Are a Pareto Frontier, Not a Ranking
Bertrand Charpentier, cofounder and chief scientist at Pruna AI, argues that state-of-the-art image generation should not be defined by a single leaderboard rank. Using Design Arena-style evaluation as his example, he says a slow top model can require 20 days of compute, about $5,300 and 556 kWh to evaluate, while a fast compressed model can run the same test in 7 hours for $265. His broader case is that model selection should be based on a Pareto frontier of quality, latency, cost and energy, not a podium that treats efficiency as secondary.
State of the art is not a single ranking
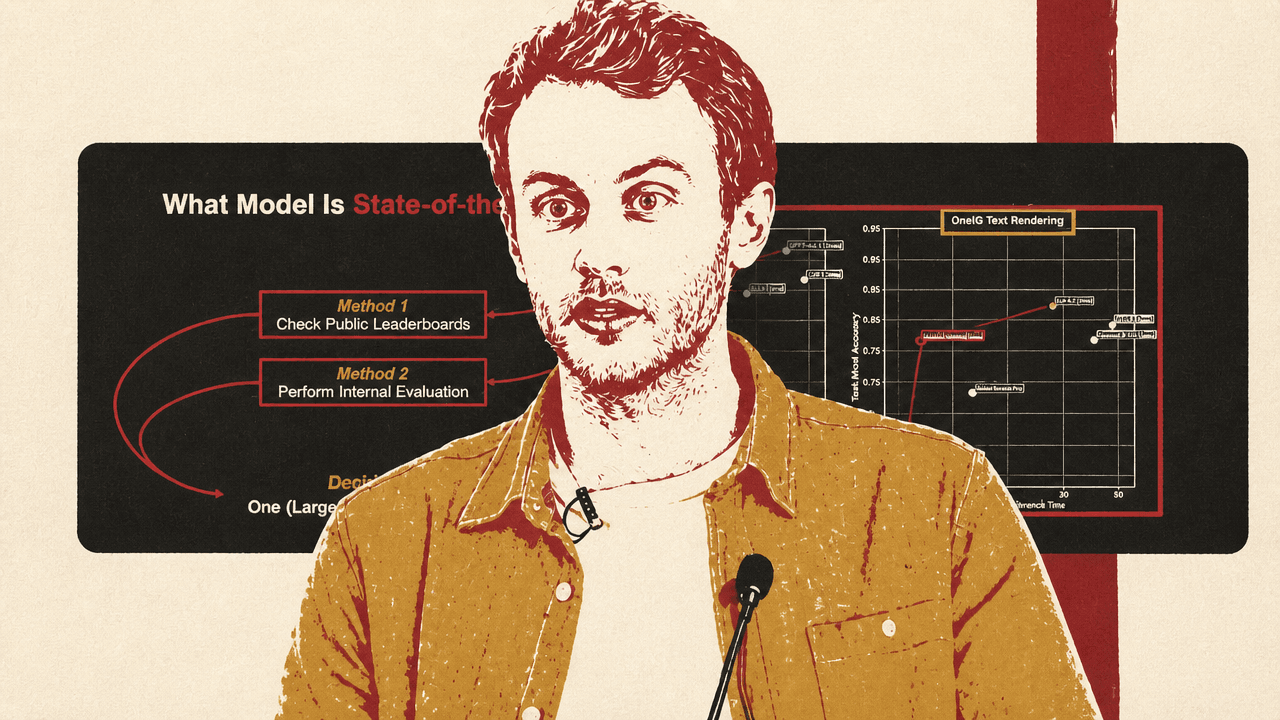
Bertrand Charpentier frames the search for a “state-of-the-art” AI model as a practical problem rather than a prestige label. Researchers and product teams want the best model for an application, but Charpentier argues that the usual ways of answering the question often collapse into a lazy default: pick a large foundation model because it sits at the top of a public leaderboard, or because a quick internal evaluation seems to favor it.
His claim is not that leaderboards or benchmarks are useless. It is that they are easy to misuse. In image editing, for example, a team might open Design Arena, find ChatGPT Image ranked first, and treat that as a satisfactory answer. Charpentier calls that a “first reasonable model at low effort,” but says it leaves out the conditions that matter most: which users will interact with the model, which tasks they will perform, how much variation exists across leaderboards, how often the top model actually loses, and what the model costs to run.
The core point is that “state of the art” changes once quality is evaluated alongside specificity and efficiency. A model can be best on an aggregate leaderboard and still be the wrong model for a particular production use case. A model can have a high ELO score and still lose a large minority of head-to-head comparisons. A model can be marginally better on a quality metric and far worse on latency, price, or energy consumption.
It’s not because ChatGPT Image is ranked top one on one leaderboard that it means that it’s the best overall.
Charpentier’s alternative is to treat model choice as a multi-dimensional decision. The relevant question is not “which model is number one?” but “which models sit on the frontier for this use case, under the constraints that matter?”
Leaderboards disagree because they measure different worlds
The first failure mode Bertrand Charpentier identifies is direct inconsistency among public leaderboards. He compares three image-editing rankings: Arena, Design Arena, and Artificial Analysis. The visible rankings do not align. The top model is not consistently the same, and relative positions shift substantially. One model, Hunyuan, appears as rank 10 on Artificial Analysis and rank 5 on Arena.
Charpentier’s explanation is that each leaderboard has “a different perspective.” Some leaderboards include models that others omit. Some contain duplicate entries. Their ELO scores also operate on different ranges: one leaderboard may place scores between roughly 1,100 and 1,300, while another uses a different scale. That makes it hard to infer absolute or relative model strength by reading a single score in isolation.
His prescription is to consult multiple leaderboards and treat disagreement as information. If rankings diverge sharply, it may mean that several models are approximately equivalent rather than that one board has uniquely discovered the truth. A top rank on one board should not be mistaken for a general-purpose guarantee.
The second failure mode is that aggregate rankings hide task-specific variation. Charpentier uses image editing examples such as removing an object, altering a background, changing texture or style, and editing text. When those tasks are separated into use-case-specific leaderboards, the rankings change again. In the examples he shows, ChatGPT Image is not ranked first on any of the task-specific boards.
His explanation is straightforward: models are trained differently, and some models are better at particular operations than others. A model that performs well across a broad distribution may not dominate any given application’s narrower distribution. Charpentier’s summary is blunt: “There is no model consistently outperforming the others.” For him, that does not make public leaderboards irrelevant. It changes how they should be used. A team building around object removal should look at object-removal results. A team building around text rendering should evaluate text rendering.
The top model still loses often enough to matter
Bertrand Charpentier’s third objection is statistical and operational: public leaderboards may not contain enough evidence for a production use case. He points to rankings built from a few thousand samples per model, contrasting that with applications that may generate far larger volumes in deployment. Some Pruna models, he says, see millions of runs per day. In that context, a public leaderboard can be smaller than the feedback a team could gather through its own usage.
The issue is not only sample count. It is also the structure of the measurement. ELO-style leaderboards are built through model battles: two outputs are compared, and users judge which is better. From those battles, one can compute a win rate. Charpentier emphasizes that even highly ranked models are not close to winning 100% of the time. In the examples he discusses, most models lose at least 40% of their battles.
That figure changes the interpretation of “best.” If a top model loses in a large minority of head-to-head comparisons, then there are many prompts, users, or conditions under which another model is preferred. If a product’s actual use case falls into that losing segment, selecting the top-ranked model means selecting the wrong model for the job.
The recommendation is to evaluate on more samples and make those samples resemble final-use conditions. Public leaderboards can orient a search, but Charpentier argues that they cannot substitute for evaluation that reflects the target users, prompts, and product environment.
Manual inspection is biased twice
Internal evaluation has its own traps. Bertrand Charpentier describes a common process in image and video generation: teams try a few prompts, inspect outputs from a few models, and develop an intuitive preference. That can be useful for getting a feel for model behavior, but he argues it is not enough to choose a model.
To demonstrate, he asks the room to compare three generated images of a boy and a parrot. Audience members ask what the requirement is and what the prompt was; Charpentier says the prompt was something like “a little boy and a parrot.” Different people prefer different images. He then repeats the exercise with three images of men eating soup with pasta. Some people change their preferences.
The first bias is personal taste. A single evaluator may prefer an output that other users would not prefer. The second bias is sample selection. A model may look strong or weak on the few prompts someone happened to inspect. In the soup example, Charpentier later reveals the models: Seedream on the left, Flux 1.1 Pro in the middle, and Pruna’s Wan Image on the right. The point of labeling them is not to crown one of them; it is to show that preference can swing across examples.
His conclusion is that manual inspection should not be trusted as the only evaluation method. Human evaluation is valuable, but only when scaled across enough people and samples. Otherwise, the evaluator is not measuring user preference at scale; they are measuring their own reaction to a small prompt set.
Automated benchmarks can fail differently. Charpentier shows rankings of eight models using CLIP score across different datasets. The ranks change from metric to metric, and the differences between model scores are often very small. If a metric is bounded between 0 and 1 or 0 and 100, but the model-to-model variation is tiny, the ranking may not provide a meaningful decision signal.
He contrasts that with metrics designed for a known task, such as text rendering. In that setting, he says the ranking is much more consistent: Z-Image appears first and P-Image second across the text-rendering metrics he shows, and the differences between models are clearer. His lesson is not “use more metrics” mechanically. It is to understand what each metric measures and whether it is aligned with the target capability.
Quality without efficiency misstates the decision
The most concrete numerical comparison in Bertrand Charpentier’s talk concerns the cost of evaluating image models. He uses ChatGPT Image as the example. The slide shows a leaderboard-style row for ChatGPT Image with a visible generation time of 1 minute and 2 seconds, and the visual attribution is OpenAI. Charpentier says the evaluation context was Design Arena, “or maybe” LM Arena, and then presents a summary table calculating what that scale of evaluation implies.
In that table, ChatGPT Image is listed at 62 seconds per generation and 26,516 evaluations. Charpentier calculates that this requires 20 days of compute, about $5,300 in cost, and 556 kWh of energy. To make the energy figure intuitive, he compares it to his own marathon energy use from Strava: roughly 400 marathons.
He then compares that with P-Image-Edit, a model he describes as one Pruna has made and as doing image editing in less than one second. At the same number of evaluations, his table says it takes 7 hours, costs $265, and consumes 4 kWh — about 4 marathons by the same comparison.
| Model | Time per generation | Evaluations | Total compute time | Total cost | Total energy |
|---|---|---|---|---|---|
| ChatGPT Image | 62s | 26,516 | 20 days | $5,300 | 556 kWh (~400 marathons) |
| P-Image-Edit | 0.9s | 26,516 | 7 hours | $265 | 4 kWh (~4 marathons) |
This comparison is central to his redefinition of state of the art. The argument is not merely that smaller or compressed models are cheaper. It is that quality-only evaluation can recommend a model whose incremental improvement is not worth its latency, cost, or energy footprint. If two models are close in quality, but one is dramatically faster and cheaper, treating the slower model as simply “better” misrepresents the practical choice.
People tend to just look at quality, but it’s important not to look only at quality but also at efficiency.
He summarizes the failure of foundation-model defaults in blunt terms: foundation models are slow, costly, and not sustainable. Efficiency is not an afterthought to be optimized after model selection; it is one of the dimensions on which model selection should occur.
The Pareto front replaces the single winner
Bertrand Charpentier’s preferred tool for model selection is the Pareto plot. On the x-axis, he places an efficiency metric such as generation latency or API price. On the y-axis, he places a quality score such as ELO. The state-of-the-art models are the ones on the Pareto front: models for which no other option is both better in quality and better in efficiency.
The slides show this as two scatter plots for image editing: one mapping quality against generation time, the other mapping quality against API price. A red Pareto frontier runs through the models that define the best available tradeoffs. The point of the picture is that “best” is not located at a single dot. It is the set of models a team can rationally choose among once it knows how much latency or cost it is willing to pay for additional quality.
In Charpentier’s image-editing plots, the quality scores of frontier models are clustered relatively tightly — roughly between 1,100 and 1,200 — while efficiency varies far more. He says a user can be 20 times faster by choosing a different model, even when quality differences are not large.
The Pareto view also lets the evaluation become task-specific. For a general image-editing benchmark, the quality axis may use a broad score. For a text-rendering product, the quality axis should use text-rendering metrics. Charpentier shows separate Pareto plots for long text and short text rendering. In that example, he says Pruna optimized Flux 2 flex models and worked with BFL, and that the result can be much faster while still sitting on the Pareto front for text rendering.
That is why his answer to “what model is state of the art?” is plural. There are multiple state-of-the-art models because the frontier contains multiple legitimate choices. A team may choose a slightly slower model for a bit more quality, or a much faster model with comparable quality, depending on application needs.
The practical output of this method is different from the leaderboard default. Instead of ending with one large foundation model, Charpentier says better evaluation tends to surface multiple smaller performance models that are strong for the specific use case.
Benchmarking survives if it becomes use-case aware
Bertrand Charpentier rejects the idea that the inconsistencies he highlights make benchmarking dead. His phrase is: “Benchmarking is dead? Long live benchmarking!” The point is that benchmarking remains useful when the design of the benchmark matches the decision being made.
His rules are consistent across the talk:
- Evaluate on many samples, because a small number of examples or battles can misrepresent deployment behavior.
- Evaluate under use-case conditions, because aggregate leaderboards and generic metrics can hide the task that matters.
- Use multiple benchmarks, because individual leaderboards and individual metrics encode different assumptions.
- Evaluate efficiency, because latency, price, and energy can dominate the real cost of a marginal quality gain.
Charpentier’s model-selection philosophy is therefore not anti-benchmark. It is anti-single-number. He wants teams to ask what the model will actually do, who will judge its output, how much uncertainty exists in the scores, and what the model costs to run.
That is also where compression enters the argument. At the end, Charpentier describes two ways Pruna tries to reach state-of-the-art performance: serving optimized performance models behind endpoints, and helping users apply inference optimization themselves through open-source packages, efficiency materials, and courses. He says Pruna has image and video models that can run between 1 and 5 seconds.
In the Q&A, an audience member asks how Pruna compresses video and image models. Charpentier names several families of methods: quantization, pruning, distillation, and caching. Quantization, he says, is applied differently to specific modules inside the model. Pruning removes components that are not important. For image and video generation, he points especially to the denoising process. Generating an image or video often involves 20 to 50 denoising steps using the same backbone; through distillation or caching, those steps can be reduced substantially — perhaps to 20 steps, or even 4, depending on how aggressive the optimization is.
The questioner says they work on MLX video and are using caching, and asks whether Pruna knows something that could make it faster. Charpentier says Pruna’s package includes many open-source algorithms for caching, and that Pruna also has internal algorithms for the models it serves behind endpoints.
That exchange is not separate from the evaluation argument. If state of the art includes efficiency, then compression methods are not merely deployment conveniences. They are ways to move a model onto the frontier: same target capability, less compute, lower latency, lower cost.